floodlight.transforms.filter
- floodlight.transforms.filter.butterworth_lowpass(xy, order=3, Wn=1, remove_short_seqs=False, **kwargs)[source]
Applies a digital Butterworth lowpass-filter to a XY data object. 1
For filtering, the scipy.filter.butter and the scipy.signal.filtfilt functions are used. This function provides a convenience access to both functions, directly applying the filter to all non-NaN sequences in all columns.
- Parameters
xy (XY) – Floodlight XY Data object.
order (int, optional) – The order of the filter. Corresponds to the argument
Nfrom the scipy. signal.butter function. Default is 3Wn (Numeric, optional) – The normalized critical cutoff frequency. Corresponds to the argument
Wnfrom the scipy.signal.butter function. Default is 1.remove_short_seqs (bool, optional) – If True, sequences that are to short for the filter with the specified settings are replaced with np.NaNs. If False, they are kept unfiltered. Default is False.
kwargs – Optional arguments {‘padtype’, ‘padlen’, ‘method’, ‘irlen’} that can be passed to the scipy.signal.filtfilt function.
- Returns
xy_filtered – XY object with position data filtered by designed Butterworth low pass filter.
- Return type
Notes
The values of the input data are assumed to be numerical. Missing data is assumed to be either np.NaN or None. The Butterworth-filter requires a minimum signal length depending on the settings. A signal is a sequence of data in the XY-object that is not interrupted by missing values. The minimum signal length is defined as \(3 \cdot (order + 1)\). The treatment of signals shorter than the minimum signal length are specified with the
remove_short_sequence-argument, where True will replace these sequences with np.NaNs ond False will keep the sequences in the data unfiltered.Examples
>>> import numpy as np
>>> import matplotlib.pyplot as plt
>>> from floodlight import XY
>>> from floodlight.transforms.filter import butterworth_lowpass
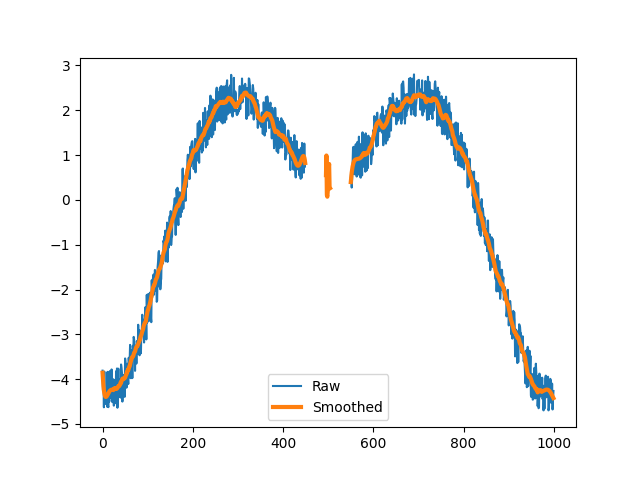
We first generate a noisy XY-object to smooth.
>>> t = np.linspace(-5, 5, 1000)
>>> player_x = np.sin(t) * t + np.random.rand(1000)
>>> player_x[450:495] = np.NaN
>>> player_x[505:550] = np.NaN
>>> player_y = t + np.random.randn()
>>> xy = XY(np.transpose(np.stack((player_x, player_y))), framerate=20)
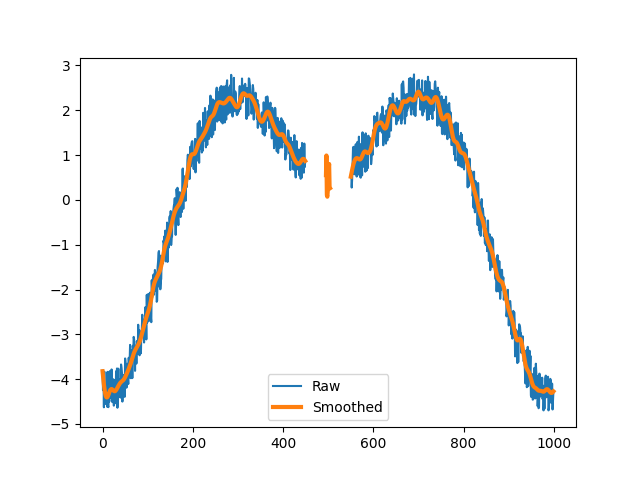
Apply the Butterworth lowpass filter with its default settings.
>>> xy_filt = butterworth_lowpass(xy)
>>> plt.plot(xy.x)
>>> plt.plot(xy_filt.x, linewidth=3)
>>> plt.legend(("Raw", "Smoothed"))
>>> plt.show()
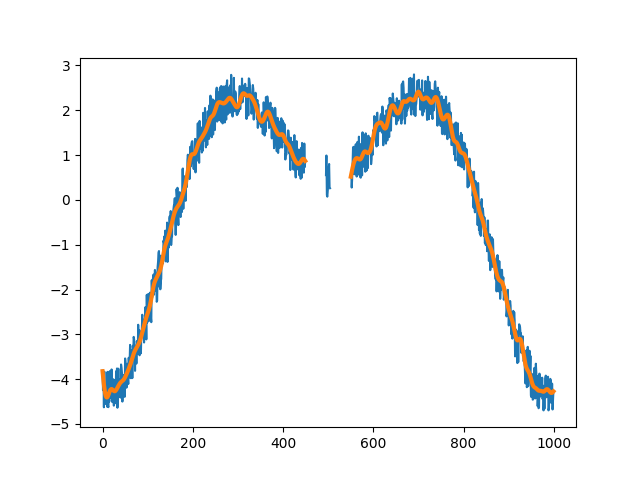
Apply the same filter but remove the sequence that is to short to filter.
>>> xy_filt = butterworth_lowpass(xy, remove_short_seqs=True)
>>> plt.plot(xy.x)
>>> plt.plot(xy_filt.x, linewidth=3)
>>> plt.legend(("Raw", "Smoothed"))
>>> plt.show()
Apply the filter with different specifications.
>>> xy_filt = butterworth_lowpass(xy, order=5, Wn=4)
>>> plt.plot(xy.x)
>>> plt.plot(xy_filt.x, linewidth=3)
>>> plt.legend(("Raw", "Smoothed"))
>>> plt.show()

References
- floodlight.transforms.filter.savgol_lowpass(xy, window_length=5, poly_order=3, remove_short_seqs=False, **kwargs)[source]
Applies a Savitzky-Golay lowpass-filter to a XY data object. 2
For filtering, the scipy.filter.savgol function is used. This function provides a convenient access to the function, directly applying the filter to all non-NaN sequences in all columns.
- Parameters
xy (XY) – Floodlight XY Data object.
window_length (int, optional) – The length of the filter window. Corresponds to the argument
window_lengthfrom the scipy.filter.savgol function. Default is 5.polyorder (Numeric, optional) – The order of the polynomial used to fit the samples.
poly_ordermust be less thanwindow_length. Default is 3. Corresponds to the argumentpolyorderfrom the scipy.filter.savgol function. Default is 5.remove_short_seqs (bool, optional) – If True, sequences that are to short for the Filter with the specified settings are removed from the data. If False, they are kept unfiltered. Default is False.
kwargs – Optional arguments {‘deriv’, ‘delta’, ‘mode’, ‘cval’} that can be passed to the scipy.signal.savgol function.
- Returns
xy_filtered – XY object with position data filtered by designed Butterworth low pass filter.
- Return type
Notes
The values of the input data are assumed to be numerical. Missing data is assumed to be either np.NaN or None. The Savitzky-Golay-filter requires a minimum signal length depending on the settings. A signal is a sequence of data in the XY-object that is not interrupted by missing values. The minimum signal length is defined as the
window_length. The treatment of signals shorter than the minimum signal length are specified with theremove_short_sequence-argument, where True will replace these sequences with np.NaNs ond False will keep the sequences in the data unfiltered.Examples
>>> import numpy as np
>>> import matplotlib.pyplot as plt
>>> from floodlight import XY
>>> from floodlight.transforms.filter import savgol_lowpass
We first generate a noisy XY-object to smooth.
>>> t = np.linspace(-5, 5, 1000)
>>> player_x = np.sin(t) * t + np.random.rand(1000)
>>> player_x[450:495] = np.NaN
>>> player_x[505:550] = np.NaN
>>> player_y = t + np.random.randn()
>>> xy = XY(np.transpose(np.stack((player_x, player_y))), framerate=20)
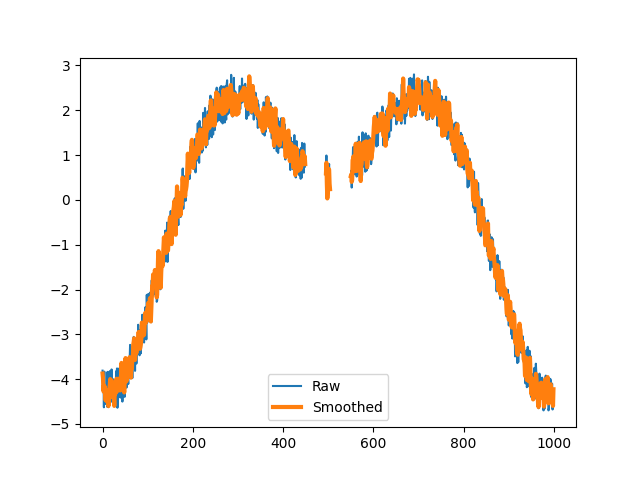
Apply the Savgol lowpass filter with its default settings.
>>> xy_filt = savgol_lowpass(xy)
>>> plt.plot(xy.x)
>>> plt.plot(xy_filt.x, linewidth=3)
>>> plt.legend(("Raw", "Smoothed"))
>>> plt.show()
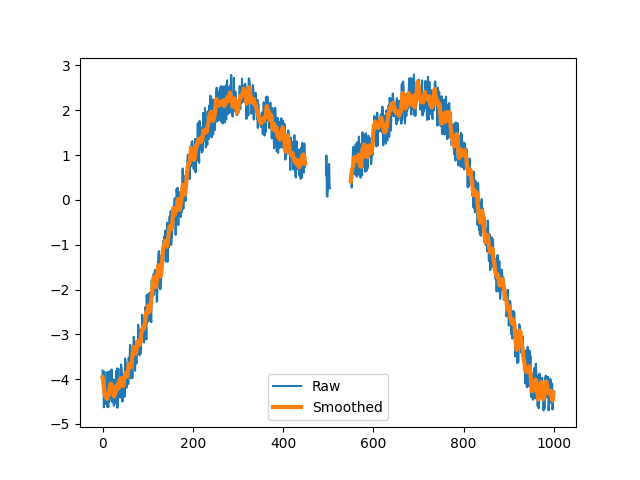
Apply the filter with a longer window lengh and remove the sequence that is to short to filter.
>>> xy_filt = savgol_lowpass(xy, window_length=12, remove_short_seqs=True)
>>> plt.plot(xy.x)
>>> plt.plot(xy_filt.x, linewidth=3)
>>> plt.legend(("Raw", "Smoothed"))
>>> plt.show()
Apply the filter with different specifications.
>>> xy_filt = savgol_lowpass(xy, window_length=50, poly_order=5)
>>> plt.plot(xy.x)
>>> plt.plot(xy_filt.x, linewidth=3)
>>> plt.legend(("Raw", "Smoothed"))
>>> plt.show()
References