floodlight.transforms.interpolation
- floodlight.transforms.interpolation.interpolate_linear(xy, xIDs=None, max_gap=None)[source]
Linearly interpolates gaps in XY tracking data along the temporal axis.
For each column, missing data gaps that are bounded by valid data on both sides are filled using linear interpolation via numpy.interp. Leading and trailing missing values are never interpolated.
- Parameters:
xy (XY) – Floodlight XY Data object.
xIDs (list of int, optional) – Player indices to interpolate. Each xID maps to two columns in the XY object (columns
2 * xIDand2 * xID + 1). If None, all columns are interpolated. Default is None.max_gap (int, optional) – Maximum gap length (in frames) to interpolate. Gaps longer than this are left unchanged. If None, all bounded gaps are interpolated regardless of length. Default is None.
- Returns:
xy_interpolated – XY object with linearly interpolated position data.
- Return type:
Notes
Interpolation is strictly temporal (along axis 0). Each column is interpolated independently. Only gaps bounded by valid data on both sides are filled; leading (before the first valid value) and trailing (after the last valid value) missing values are preserved. This prevents extrapolation, e.g. for substituted players who are not yet on the field.
Examples
>>> import numpy as np
>>> import matplotlib.pyplot as plt
>>> from floodlight import XY
>>> from floodlight.transforms.interpolation import interpolate_linear
Create an XY object with missing data gaps.
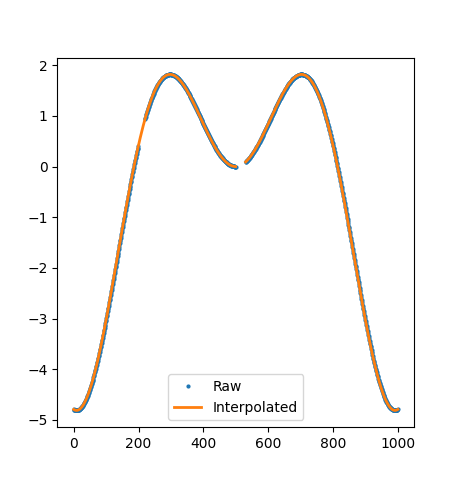
>>> t = np.linspace(-5, 5, 1000)
>>> player_x = np.sin(t) * t
>>> player_x[200:220] = np.nan
>>> player_x[500:530] = np.nan
>>> player_y = t
>>> xy = XY(np.transpose(np.stack((player_x, player_y))), framerate=20)
Apply linear interpolation with default settings.
>>> xy_interp = interpolate_linear(xy)
>>> plt.plot(xy.x, 'o', markersize=2)
>>> plt.plot(xy_interp.x, linewidth=2)
>>> plt.legend(("Raw", "Interpolated"))
>>> plt.show()

Apply linear interpolation with a maximum gap length of 25 frames.
>>> xy_interp = interpolate_linear(xy, max_gap=25)
>>> plt.plot(xy.x, 'o', markersize=2)
>>> plt.plot(xy_interp.x, linewidth=2)
>>> plt.legend(("Raw", "Interpolated"))
>>> plt.show()

- floodlight.transforms.interpolation.interpolate_polynomial(xy, order=3, xIDs=None, max_gap=None)[source]
Interpolates gaps in XY tracking data using piecewise polynomial interpolation along the temporal axis.
For each column, gaps that are bounded by valid data on both sides are filled using piecewise polynomial interpolation via scipy.interpolate.interp1d. Leading and trailing missing values are not extrapolated.
- Parameters:
xy (XY) – Floodlight XY Data object.
order (int, optional) – Polynomial order for interpolation. Higher orders produce smoother curves but require more valid data points (at least
order + 1). Default is 3 (cubic).xIDs (list of int, optional) – Player indices to interpolate. Each xID maps to two columns in the XY object (columns
2 * xIDand2 * xID + 1). If None, all columns are interpolated. Default is None.max_gap (int, optional) – Maximum gap length (in frames) to interpolate. Gaps longer than this are left unchanged. If None, all bounded gaps are interpolated regardless of length. Default is None.
- Returns:
xy_interpolated – XY object with polynomial-interpolated position data.
- Return type:
Notes
Interpolation is strictly temporal (along axis 0). Each column is interpolated independently. Only gaps bounded by valid data on both sides are filled; leading (before the first valid value) and trailing (after the last valid value) missing values are preserved. This prevents extrapolation, e.g. for substituted players who are not yet on the field.
The interpolator is constructed from all valid data points in the column. If the total number of valid points is less than
order + 1, the column is returned unchanged. Interpolation quality depends on the density of valid data surrounding each gap.Examples
>>> import numpy as np
>>> import matplotlib.pyplot as plt
>>> from floodlight import XY
>>> from floodlight.transforms.interpolation import interpolate_polynomial
Create an XY object with missing data gaps.
>>> t = np.linspace(-5, 5, 1000)
>>> player_x = np.sin(t) * t
>>> player_x[200:220] = np.nan
>>> player_x[500:530] = np.nan
>>> player_y = t
>>> xy = XY(np.transpose(np.stack((player_x, player_y))), framerate=20)
Apply polynomial interpolation with default settings (cubic).
>>> xy_interp = interpolate_polynomial(xy)
>>> plt.plot(xy.x, 'o', markersize=2)
>>> plt.plot(xy_interp.x, linewidth=2)
>>> plt.legend(("Raw", "Interpolated"))
>>> plt.show()

Apply polynomial interpolation with a maximum gap length of 25 frames.
>>> xy_interp = interpolate_polynomial(xy, max_gap=25)
>>> plt.plot(xy.x, 'o', markersize=2)
>>> plt.plot(xy_interp.x, linewidth=2)
>>> plt.legend(("Raw", "Interpolated"))
>>> plt.show()
- floodlight.transforms.interpolation.interpolate_spline(xy, k=3, xIDs=None, max_gap=None)[source]
Interpolates gaps in XY tracking data using spline interpolation along the temporal axis.
For each column, gaps that are bounded by valid data on both sides are filled using spline interpolation via scipy.interpolate.make_interp_spline. Leading and trailing missing values are never interpolated.
- Parameters:
xy (XY) – Floodlight XY Data object.
k (int, optional) – Spline degree. Higher degrees produce smoother curves but require more valid data points (at least
k + 1). Default is 3 (cubic spline).xIDs (list of int, optional) – Player indices to interpolate. Each xID maps to two columns in the XY object (columns
2 * xIDand2 * xID + 1). If None, all columns are interpolated. Default is None.max_gap (int, optional) – Maximum gap length (in frames) to interpolate. Gaps longer than this are left unchanged. If None, all bounded gaps are interpolated regardless of length. Default is None.
- Returns:
xy_interpolated – XY object with spline-interpolated position data.
- Return type:
Notes
Interpolation is strictly temporal (along axis 0). Each column is interpolated independently. Only gaps bounded by valid data on both sides are filled; leading (before the first valid value) and trailing (after the last valid value) missing values are preserved. This prevents extrapolation, e.g. for substituted players who are not yet on the field.
Unlike piecewise polynomial interpolation, spline interpolation guarantees smoothness at the joints between segments (C2 continuity for cubic splines). This produces more realistic trajectories for tracking data.
The interpolator is constructed from all valid data points in the column. If the total number of valid points is less than
k + 1, the column is returned unchanged. Interpolation quality depends on the density of valid data surrounding each gap.Examples
>>> import numpy as np
>>> import matplotlib.pyplot as plt
>>> from floodlight import XY
>>> from floodlight.transforms.interpolation import interpolate_spline
Create an XY object with missing data gaps.
>>> t = np.linspace(-5, 5, 1000)
>>> player_x = np.sin(t) * t
>>> player_x[200:220] = np.nan
>>> player_x[500:530] = np.nan
>>> player_y = t
>>> xy = XY(np.transpose(np.stack((player_x, player_y))), framerate=20)
Apply spline interpolation with default settings (cubic).
>>> xy_interp = interpolate_spline(xy)
>>> plt.plot(xy.x, 'o', markersize=2)
>>> plt.plot(xy_interp.x, linewidth=2)
>>> plt.legend(("Raw", "Interpolated"))
>>> plt.show()

Apply spline interpolation with a maximum gap length of 25 frames.
>>> xy_interp = interpolate_spline(xy, max_gap=25)
>>> plt.plot(xy.x, 'o', markersize=2)
>>> plt.plot(xy_interp.x, linewidth=2)
>>> plt.legend(("Raw", "Interpolated"))
>>> plt.show()
