Tutorial: Match Sheet Creation
In this tutorial we will create match sheets from the openly published event data from StatsBomb with the interface and objects provided by floodlight. Our goal is to load a match from the dataset, extract information about the scored goals, and use this information to create a match sheet.
Setup
First we need some data to work with. The open StatsBomb dataset contains (amongst others) data from the UEFA Euro 2020 with (partial) information about the player positions at the events which can be used for our purpose. From this dataset we load a single match from the dataset and also get the corresponding pitch information.
from floodlight.io.datasets import StatsBombOpenDataset

# load a match from the UEFA Euro 2020
dataset = StatsBombOpenDataset()
events_objects, teamsheets = dataset.get("UEFA Euro", "2020", "Croatia vs. Spain")
pitch = dataset.get_pitch()

# unpack the queried data
home_ht1 = events_objects["HT1"]["Home"]
home_ht2 = events_objects["HT2"]["Home"]
away_ht1 = events_objects["HT1"]["Away"]
away_ht2 = events_objects["HT2"]["Away"]
The variables home_ht1, home_ht2, away_ht1, and away_ht2 are Events objects containing the events of the teams during the first and second half. These will be used to create the match sheets. The pitch variable is a Pitch object that contains information regarding the pitch specification and coordinate system our data live in.
Data Preparation
To create match sheets from the event data we want to select certain (important) events to look at. To keep it short and simple we stick to goals. We use the select function from the floodlight.core.events submodule to find all shots with a positive outcome (1).
home_goals_ht1 = home_ht1.select(
    conditions=[("event_name", "Shot"), ("outcome", 1)]
)
home_goals_ht2 = home_ht2.select(
    conditions=[("event_name", "Shot"), ("outcome", 1)]
)
away_goals_ht1 = away_ht1.select(
    conditions=[("event_name", "Shot"), ("outcome", 1)]
)
away_goals_ht2 = away_ht2.select(
    conditions=[("event_name", "Shot"), ("outcome", 1)]
)
Similarly, we must not forget about own goals in the data!
home_owngoals_ht1 = home_ht1.select(
    conditions=[("event_name", "Own Goal For")]
)
home_owngoals_ht2 = home_ht2.select(
    conditions=[("event_name", "Own Goal For")]
)
away_owngoals_ht1 = away_ht1.select(
    conditions=[("event_name", "Own Goal For")]
)
away_owngoals_ht2 = away_ht2.select(
    conditions=[("event_name", "Own Goal For")]
)
Finally, we collect all goals into a single pandas DataFrame.
import pandas as pd

all_goals = pd.concat(
    (
        home_goals_ht1,
        home_goals_ht2,
        home_owngoals_ht1,
        home_owngoals_ht2,
        away_goals_ht1,
        away_goals_ht2,
        away_owngoals_ht1,
        away_owngoals_ht2,
    )
).sort_values("gameclock")
Here’s the (formatted) DataFrame you should get:
eID |
gameclock |
pID |
tID |
mID |
outcome |
timestamp |
minute |
second |
at_x |
at_y |
to_x |
to_y |
event_name |
player_name |
team_name |
qualifier |
|---|---|---|---|---|---|---|---|---|---|---|---|---|---|---|---|---|
25 |
1172.344 |
nan |
785 |
3794686 |
nan |
0:19:32.433 |
19 |
32 |
68.3 |
62.1 |
nan |
nan |
Own Goal For |
None |
Croatia |
… |
16 |
2248.398 |
6720 |
772 |
3794686 |
1 |
0:37:28.398 |
37 |
28 |
109.0 |
43.3 |
120.0 |
42.6 |
Shot |
Pablo Sarabia Garcia |
Spain |
… |
16 |
3366.771 |
3957 |
772 |
3794686 |
1 |
0:11:06.771 |
56 |
6 |
115.3 |
42.4 |
120.0 |
41.0 |
Shot |
Cesar Azpilicueta Tanco |
Spain |
… |
16 |
4562.056 |
6748 |
772 |
3794686 |
1 |
0:31:02.056 |
76 |
2 |
112.1 |
51.2 |
120.0 |
39.5 |
Shot |
Ferran Torres Garcia |
Spain |
… |
16 |
5056.385 |
16527 |
772 |
3794686 |
1 |
0:39:16.385 |
84 |
16 |
119.0 |
40.9 |
120.0 |
42.5 |
Shot |
Mislav Orsic |
Croatia |
… |
16 |
5511.058 |
11603 |
772 |
3794686 |
1 |
0:46:51.058 |
91 |
51 |
114.2 |
37.2 |
120.0 |
41.9 |
Shot |
Mario Pasalic |
Croatia |
… |
Data Extraction
Alright, now let’s try to extract the relevant information from the above DataFrame. First we want to extract some meta information about the goals. For later use we write a function get_goal_info(goal) for that matter.
import ast

def get_goal_info(goal):
    scoring_team = goal["team_name"]
    if goal["event_name"] == "Shot":
        scoring_player = goal["player_name"]
        xG = ast.literal_eval(goal["qualifier"])["shot"]["statsbomb_xg"]
    else:
        scoring_player = "Own Goal"
        xG = None
    return scoring_team, scoring_player, xG
Next, we deal with the previously mentioned StatsBomb360 position data. The appropriate floodlight object to deal with position data is a XY object. To create XY objects that relate to a single frame of the match we have to bring them into shape (1, N). Therefore we define the function get_xy_data(goal).
import numpy as np
from floodlight import XY

def get_xy_data(goal):
    # read positions at event
    qualifier = ast.literal_eval(goal["qualifier"])
    freeze_frame = None
    if "360_freeze_frame" in qualifier:
        freeze_frame = qualifier["360_freeze_frame"]
    # set "to-location" to goal center if not available
    at_x, at_y, to_x, to_y = goal["at_x"], goal["at_y"], goal["to_x"], goal["to_y"]
    if np.isnan(goal["to_x"]):
        to_x = 120
    if np.isnan(goal["to_y"]):
        to_y = 40
    xy_ball = np.array([[at_x, at_y], [to_x, to_y]])
    xy_off, xy_def = None, None
    if freeze_frame is not None:
        # create arrays
        xy_off = np.array(
            [player["location"] for player in freeze_frame if player["teammate"]]
        )
        xy_def = np.array(
            [player["location"] for player in freeze_frame if not player["teammate"]]
        )
        # reshape arrays to represent a single frame
        xy_off = xy_off.flatten()
        xy_off = xy_off.reshape((1, len(xy_off)))
        xy_def = xy_def.flatten()
        xy_def = xy_def.reshape((1, len(xy_def)))
    # return XY objects
    return XY(xy=xy_ball), XY(xy=xy_off), XY(xy=xy_def)
Plotting
Now we can use the predefined functions to create a plot of a single goal (e.g. the last) with the plotting functionality of the XY and Pitch object.
import matplotlib.pyplot as plt
goal = all_goals.loc[all_goals.index[-1]]
fig, ax = plt.subplots()
scoring_team, scoring_player, xG = get_goal_info(goal)
ax.set_title(
    f"Goal for {scoring_team} by {str(scoring_player)} "
    f"|| xG: {round(xG, 2) if xG is not None else 'NA'}",
    fontdict={"size": 9},
)
pitch.plot(ax=ax)
xy_ball, xy_off, xy_def = get_xy_data(goal)
xy_ball.plot(
    t=(0, 2),
    plot_type="trajectories",
    ball=True,
    color="k",
    linewidth=2,
    linestyle="--",
    marker="X",
    markevery=[0],
    ax=ax,
)
if xy_off.xy is not None and xy_def.xy is not None:
    xy_off.plot(t=0, ax=ax, color="red")
    xy_def.plot(t=0, ax=ax, color="white")
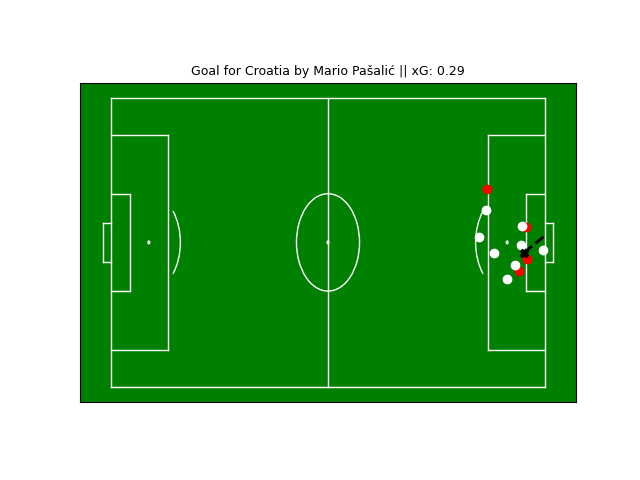
This is a neat start! However, our goal is to summarize the whole match into a single match sheet that displays all the goals.
Therefore, we setup a grid of subplots (in this case a 2x3 grid for the six goals). We add a legend with our designated colors for the two teams.
import matplotlib.pyplot as plt
import matplotlib.patches as mpatches

rows = np.minimum(len(all_goals), 2)
cols = int(np.ceil(len(all_goals) / 2))
fig, ax = plt.subplots(rows, cols, figsize=(14, 7))
plt.suptitle("Match Sheet: Croatia vs. Spain (EURO 2020)")
plt.legend(
    handles=[
        mpatches.Patch(label="Croatia (left to right)", color="white"),
        mpatches.Patch(label="Spain (right to left)", color="red"),
    ]
)
Now we create the match sheet by iterating over all goals and updating the respective subplots. For visibility we want to display the goals for Spain at the left side of the pitch. Therefore we use the rotate and translate functions of the floodlight XY module.
row, col, home_score, away_score = 0, 0, 0, 0
colors = {"Croatia": "white", "Spain": "red"}
for idx in all_goals.index:
    # display meta information
    scoring_team, scoring_player, xG = get_goal_info(all_goals.loc[idx])
    if scoring_team == "Croatia":
        conceding_team = "Spain"
        home_score += 1
    else:  # score by Spain
        conceding_team = "Croatia"
        away_score += 1
    ax[row, col].set_title(
        f"{home_score}:{away_score} for {str(scoring_team)} by {str(scoring_player)} "
        f"|| xG: {round(xG, 2) if xG is not None else 'NA'}",
        fontdict={"size": 10},
    )
    # get position data
    xy_ball, xy_off, xy_def = get_xy_data(all_goals.loc[idx])
    # rotate position data towards left goal for Spain
    if scoring_team == "Spain" and xy_off.xy is not None and xy_def.xy is not None:
        xy_off.rotate(180)
        xy_off.translate((pitch.xlim[1], pitch.ylim[1]))
        xy_def.rotate(180)
        xy_def.translate((pitch.xlim[1], pitch.ylim[1]))
        xy_ball.rotate(180)
        xy_ball.translate((pitch.xlim[1], pitch.ylim[1]))
    # plot pitch and position data
    pitch.plot(ax=ax[row, col])
    xy_ball.plot(
        t=(0, 2),
        plot_type="trajectories",
        ball=True,
        color="k",
        linewidth=2,
        linestyle="--",
        marker="X",
        markevery=[0],
        ax=ax[row, col],
    )
    if xy_off.xy is not None and xy_def.xy is not None:
        xy_off.plot(t=0, ax=ax[row, col], color=colors[scoring_team])
        xy_def.plot(t=0, ax=ax[row, col], color=colors[conceding_team])
    # update grid position
    col += 1
    if col == cols:
        col = 0
        row += 1
The result should look similar to the image below. However, due to an update in the StatsBomb dataset the FreezeFrame for the OwnGoal is no longer available. Thus, there will only be the trajectory of the ball in this plot. Also, keep in mind that the StatsBomb360 data does only contain the positions from some players at the event (extracted from the camera angle). That’s why you can not see the player responsible for the own goal in the first plot.
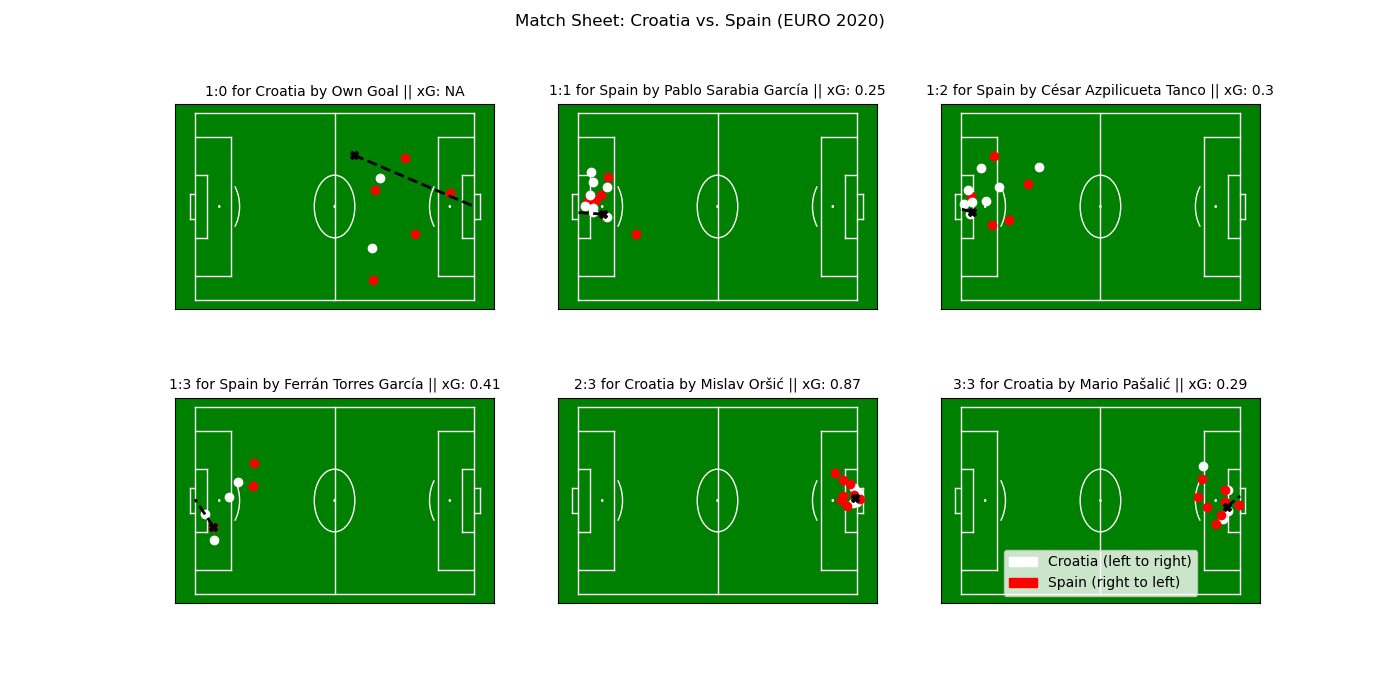
Feel free to try out this code with other matches from the StatsBomb dataset (dataset.available_matches) and also to experiment with other event types, plotting styles and your own ideas!