floodlight.vis.pitches
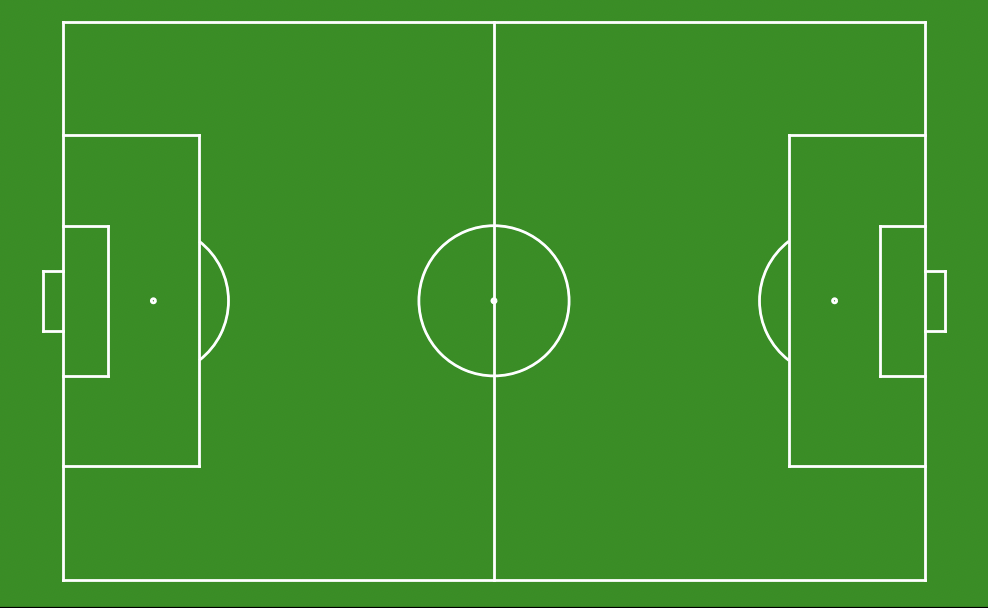
- floodlight.vis.pitches.plot_football_pitch(xlim, ylim, length, width, unit, color_scheme, show_axis_ticks, ax, **kwargs)[source]
Plots a football pitch on a given matplotlib.axes.
- Parameters:
xlim (Tuple[Numeric, Numeric]) – Limits of pitch boundaries in longitudinal direction. This tuple has the form (x_min, x_max) and delimits the length of the pitch (not of any actual data) within the coordinate system.
ylim (Tuple[Numeric, Numeric]) – Limits of pitch boundaries in lateral direction. This tuple has the form (y_min, y_max) and delimits the width of the pitch (not of any actual data) within the coordinate system.
length (Numeric) – Length of the actual pitch in unit.
width (Numeric, optional) – Width of the actual pitch in unit.
unit (str) – The unit in which data is measured along axes. Possible types are {‘m’, ‘cm’, ‘percent’}.
color_scheme (str) – Color scheme of the plot. One of {‘standard’, ‘bw’}.
show_axis_ticks (bool) – If set to True, the axis ticks are visible.
ax (matplotlib.axes) – Axes from matplotlib library on which the football field is plotted.
kwargs – Optional keyworded arguments {‘linewidth’, ‘zorder’, ‘scalex’, ‘scaley’} which can be used for the plot functions from matplotlib. The kwargs are only passed to all the plot functions of matplotlib.
- Returns:
axes – Axes from matplotlib library on which a football pitch is plotted.
- Return type:
matplotlib.axes
Notes
The kwargs are only passed to the plot functions of matplotlib. To customize the plots have a look at matplotlib. For example in order to modify the linewidth pass a float to the keyworded argument ‘linewidth’. The same principle applies to other kwargs like ‘zorder’, ‘scalex’ and ‘scaley’.
Examples
>>> import matplotlib.pyplot as plt
>>> from floodlight.vis.pitches import plot_football_pitch
>>> # create matplotlib.axes
>>> ax = plt.subplots()[1]
>>> # plot handball pitch
>>> plot_football_pitch(xlim=(0,108), ylim=(0,68), length=108, width=68, unit='m',
>>>                     color_scheme='standard', show_axis_ticks=False, ax=ax)
>>> plt.show()
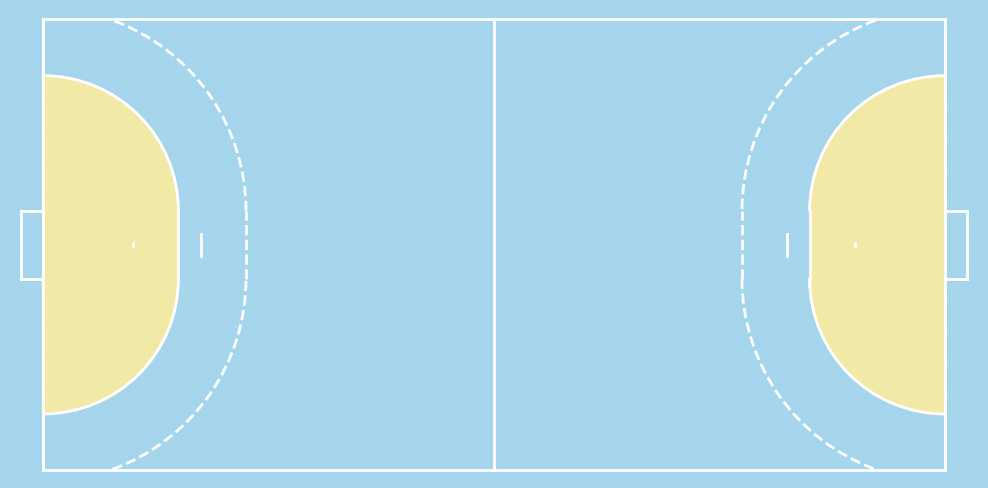
- floodlight.vis.pitches.plot_handball_pitch(xlim, ylim, unit, color_scheme, show_axis_ticks, ax, **kwargs)[source]
Plots a handball pitch on a given matplotlib.axes.
- Parameters:
xlim (Tuple[Numeric, Numeric]) – Limits of pitch boundaries in longitudinal direction. This tuple has the form (x_min, x_max) and delimits the length of the pitch (not of any actual data) within the coordinate system.
ylim (Tuple[Numeric, Numeric]) – Limits of pitch boundaries in lateral direction. This tuple has the form (y_min, y_max) and delimits the width of the pitch (not of any actual data) within the coordinate system.
unit (str) – The unit in which data is measured along axes. Possible types are {‘m’, ‘cm’, ‘percent’}.
color_scheme (str) – Color scheme of the plot. One of {‘standard’, ‘bw’}.
show_axis_ticks (bool) – If set to True, the axis ticks are visible.
ax (matplotlib.axes) – Axes from matplotlib library on which the handball field is plotted.
kwargs – Optional keyworded arguments {‘linewidth’, ‘zorder’, ‘scalex’, ‘scaley’} which can be used for the plot functions from matplotlib. The kwargs are only passed to all the plot functions of matplotlib.
- Returns:
axes – Axes from matplotlib library on which a handball pitch is plotted.
- Return type:
matplotlib.axes
Notes
The kwargs are only passed to the plot functions of matplotlib. To customize the plots have a look at matplotlib. For example in order to modify the linewidth pass a float to the keyworded argument ‘linewidth’. The same principle applies to other kwargs like ‘zorder’, ‘scalex’ and ‘scaley’.
Examples
>>> import matplotlib.pyplot as plt
>>> from floodlight.vis.pitches import plot_handball_pitch
>>> # create matplotlib.axes
>>> ax = plt.subplots()[1]
>>> # plot handball pitch
>>> plot_handball_pitch(xlim=(0,40), ylim=(0,20), unit='m', color_scheme='standard',
>>>                     show_axis_ticks=False, ax=ax)
>>> plt.show()