floodlight.vis.positions
- floodlight.vis.positions.plot_positions(xy, frame, ball, ax, **kwargs)[source]
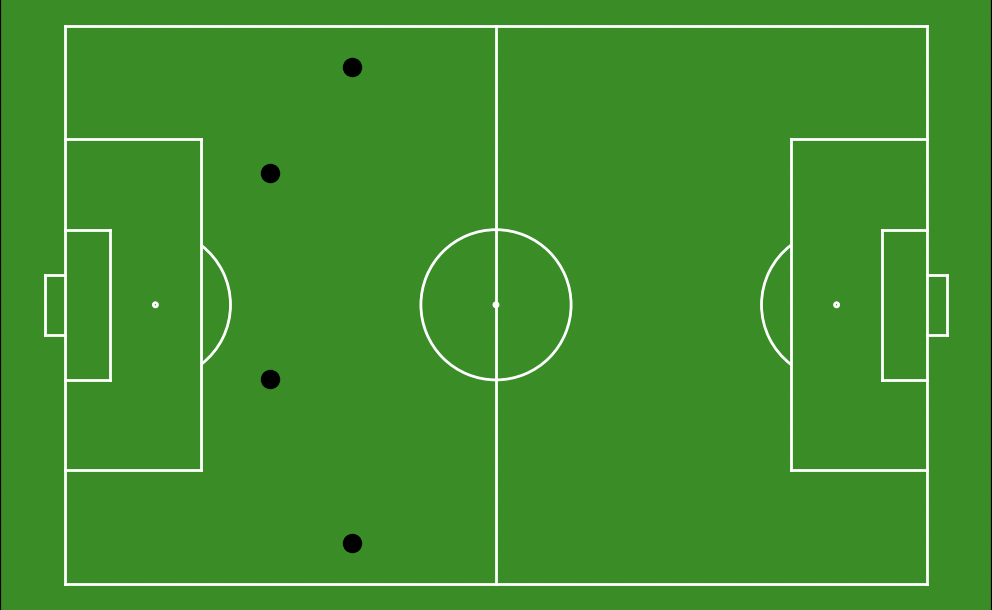
Scatter plots positions for a given frame of an XY object on a matplotlib.axes.
- Parameters:
xy (floodlight.core.xy.XY) – XY object containing spatiotemporal data to be plotted.
frame (int) – Number of frame to be plotted.
ball (bool) – Boolean indicating whether this object is storing ball data. If set to False marker=”o”, else marker=”.”.
ax (matplotlib.axes) – Axes from matplotlib library on which the positions are plotted.
kwargs – Optional keyworded arguments e.g. {‘color’, ‘zorder’, ‘marker’} which can be used for the plot functions from matplotlib. The kwargs are only passed to the plot functions of matplotlib.
- Returns:
axes – Axes from matplotlib library on which the positions are plotted.
- Return type:
matplotlib.axes
Notes
The kwargs are only passed to the plot functions of matplotlib. To customize the plots have a look at matplotlib. For example in order to modify the color of the points pass a color name or rgb-value (matplotlib colors) to the keyworded argument ‘color’. The same principle applies to other kwargs like ‘zorder’ and ‘marker’.
Examples
>>> import matplotlib.pyplot as plt
>>> import numpy as np
>>> from floodlight.core.xy import XY
>>> from floodlight.core.pitch import Pitch
>>> from floodlight.vis.positions import plot_positions
>>> # positions
>>> pos = np.array(
>>>     [[35,5,35,63,25,25,25,50],
>>>     [45,10,45,55,35,20,35,45],
>>>     [55,10,55,55,45,20,45,45],
>>>     [88.5,20,88.5,30,88.5,40,88.5,50]])
>>> # create XY object
>>> xy_pos = XY(pos)
>>> # create Pitch object
>>> football_pitch = Pitch(xlim=(0,105), ylim=(0, 68), unit="m", sport="football")
>>> # create matplotlib.axes
>>> ax = plt.subplots()[1]
>>> # plot football pitch on ax
>>> football_pitch.plot(ax=ax)
>>> # plot positions on ax
>>> plot_positions(xy=xy_pos, frame=0, ball=False, ax=ax)
>>> plt.show()
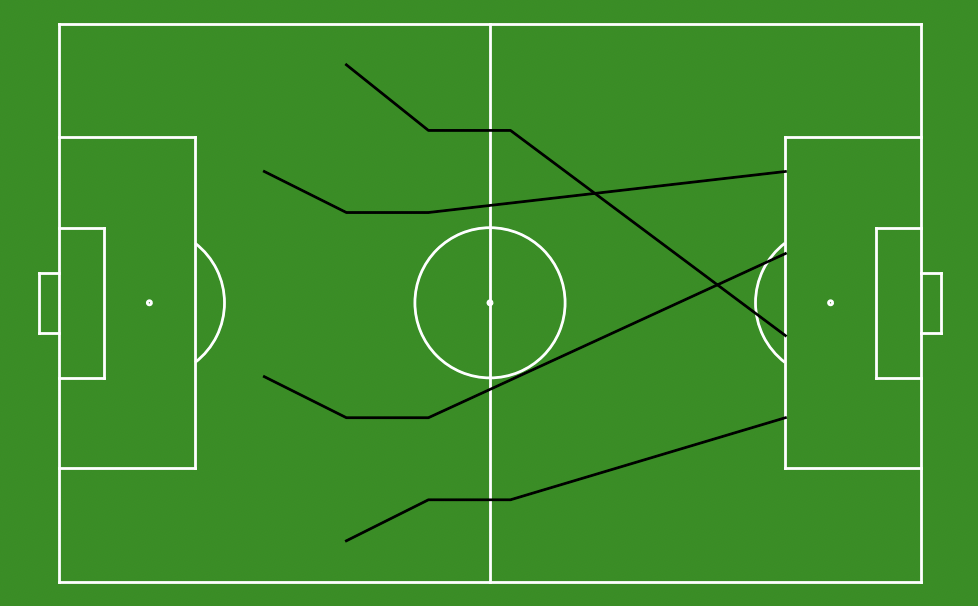
- floodlight.vis.positions.plot_trajectories(xy, start_frame, end_frame, ball, ax, **kwargs)[source]
Draws the trajectories of an XY object from a given time interval on a matplotlib.axes.
- Parameters:
xy (floodlight.core.xy.XY) – XY object containing spatiotemporal data to be plotted.
start_frame (int) – Starting frame of time interval to be plotted.
end_frame (int) – Closing frame of time interval to be plotted.
ball (bool) – Boolean indicating whether this object is storing ball data. If set to False marker=”o”, else marker=”.”.
ax (matplotlib.axes) – Axes from matplotlib library on which the trajectories are drawn.
kwargs – Optional keyworded arguments e.g. {‘linewidth’, ‘zorder’, ‘linestyle’, ‘alpha’} which can be used for the plot functions from matplotlib. The kwargs are only passed to all the plot functions of matplotlib.
- Returns:
axes – Axes from matplotlib library on which the trajectories are drawn.
- Return type:
matplotlib.axes
Notes
The kwargs are only passed to the plot functions of matplotlib. To customize the plots have a look at matplotlib. For example in order to modify the color of the lines pass a color name or rgb-value (matplotlib colors) to the keyworded argument ‘color’. The same principle applies to other kwargs like ‘zorder’ and ‘linestyle’.
Examples
>>> import matplotlib.pyplot as plt
>>> import numpy as np
>>> from floodlight.core.xy import XY
>>> from floodlight.core.pitch import Pitch
>>> from floodlight.vis.positions import plot_trajectories
>>> # positions
>>> pos = np.array(
>>>     [[35,5,35,63,25,25,25,50],
>>>     [45,10,45,55,35,20,35,45],
>>>     [55,10,55,55,45,20,45,45],
>>>     [88.5,20,88.5,30,88.5,40,88.5,50]])
>>> # create XY object
>>> xy_pos = XY(pos)
>>> # create matplotlib.axes
>>> ax = plt.subplots()[1]
>>> # create Pitch object
>>> football_pitch = Pitch(xlim=(0,105), ylim=(0, 68), unit="m", sport="football")
>>> # plot football pitch on ax
>>> football_pitch.plot(ax=ax)
>>> # plot positions on ax
>>> plot_trajectories(xy=xy_pos, start_frame=0, end_frame=4, ball=False, ax=ax)
>>> plt.show()