floodlight.models.space
- class floodlight.models.space.DiscreteVoronoiModel(pitch, mesh='square', xpoints=100)[source]
Calculates discretized versions of the Voronoi tessellation commonly used to assess space control.
Upon instantiation, this model creates a mesh grid that spans the entire pitch with a fixed number of mesh points. When calling the
fit()-method, closest players to the respective mesh points are evaluated and their control assigned to players. Thus, cumulative controls and controlled areas are calculated on a discretization of the pitch. The following calculations can subsequently be queried by calling the corresponding methods:Player Space Control –>
player_controls()Team Space Control –>
team_controls()
Furthermore, the following plotting methods are available to visualize the model:
Plot controlled areas –>
plot()Plot mesh grid –>
plot_mesh()
- Parameters
pitch (Pitch) – A floodlight Pitch object corresponding to the XY data that will be supplied to the model. The mesh created during instantiation will span this pitch.
mesh ({‘square’, ‘hexagonal’}, optional) – A string indicating the type of mesh that will be generated. ‘square’ will generate a grid-like mesh with square cell shapes (default). ‘hexagonal’ will generate a mesh with hexagonal cell shapes where mesh points have equidistant neighbours.
xpoints (int, optional) – The number of mesh grid points used in x-direction. Must be in range [10, 1000] and defaults to 100. The number of messh grid points in y-direction will be inferred automatically to match the shape of the pitch and produce regular mesh cell shapes.
Notes
The original work by Taki and Hasegawa proposed to use Voronoi tessellations for assessing player dominant regions 1. This approach has later been simplified by using the Euclidean distance when allocating space to players 2 , 3. Instead of computing algebraic Voronoi regions, this model discretizes the problem by sampling space control on a finite number of mesh points across the pitch. This runs much faster and can be easier to handle. If an appropriate number of mesh points is chosen, the resulting error is expected to be negligible given the common spatial inaccuracies of tracking data as well as variations in moving players’ centers of masses.
References
Examples
>>> import numpy as np
>>> from floodlight import XY, Pitch
>>> from floodlight.models.space import DiscreteVoronoiModel
>>> # create data and fit model
>>> xy1 = XY(np.array(((10, 10, 20, 80, 30, 40), (10, 10, np.nan, np.nan, 35, 35))))
>>> xy2 = XY(np.array(((90, 90, 80, 20, 75, 80), (90, 90, 75, 25, 80, 70))))
>>> pitch = Pitch.from_template("opta", length=105, width=68)
>>> dvm = DiscreteVoronoiModel(pitch)
>>> dvm.fit(xy1, xy2)
>>> # print player controls [%] for first team
>>> player_control1, player_control2 = dvm.player_controls()
>>> print(player_control1.property)
[[10.63 19.32 21.71]
 [10.35  0.   36.56]]
>>> # print team controls [%] for first team
>>> team_control1, team_control2 = dvm.team_controls()
>>> print(team_control1.property)
[[51.66]
 [46.91]]
- fit(xy1, xy2)[source]
Fit the model to the given data and calculate control values for mesh points.
- Parameters
xy1 (XY) – Player spatiotemporal data of the first team.
xy2 (XY) – Player spatiotemporal data of the second team.
- player_controls()[source]
Returns the percentage of mesh points controlled by each player of the first and second team.
- Returns
player_controls – One Property object for each team (corresponding to the fitted xy1 and xy2) of shape (n_frames x n_players), respectively. Property objets contain the percentage of points controlled by each player on the pitch.
- Return type
Tuple[PlayerProperty, PlayerProperty]
- plot(t=0, team_colors=('red', 'blue'), ax=None, **kwargs)[source]
Plots the fitted mesh grid colored by team controls for a given time point on a matplotlib axes.
- Parameters
t (int, optional) – Frame for which controls are plotted. Defaults to 0.
team_colors (Tuple[str, str], optional) – Tuple of two colors in a format accepted by matplotlib that is used to color team specific control areas. Defaults to (‘red’, ‘blue’).
ax (matplotlib.axes, optional) – Axes from matplotlib library to plot on. Defaults to None.
kwargs – Optional keyworded arguments e.g. {‘zorder’, ‘ec’, ‘alpha’} which can be used for the plot functions from matplotlib. The kwargs are only passed to all the plot functions of matplotlib. If not given default values are used.
- Returns
axes – Axes from matplotlib library with plot.
- Return type
matplotlib.axes
Notes
The kwargs are only passed to the plot functions of matplotlib. To customize the plots have a look at matplotlib.
Examples
Given a DiscreteVoronoiModel that has already been fitted:
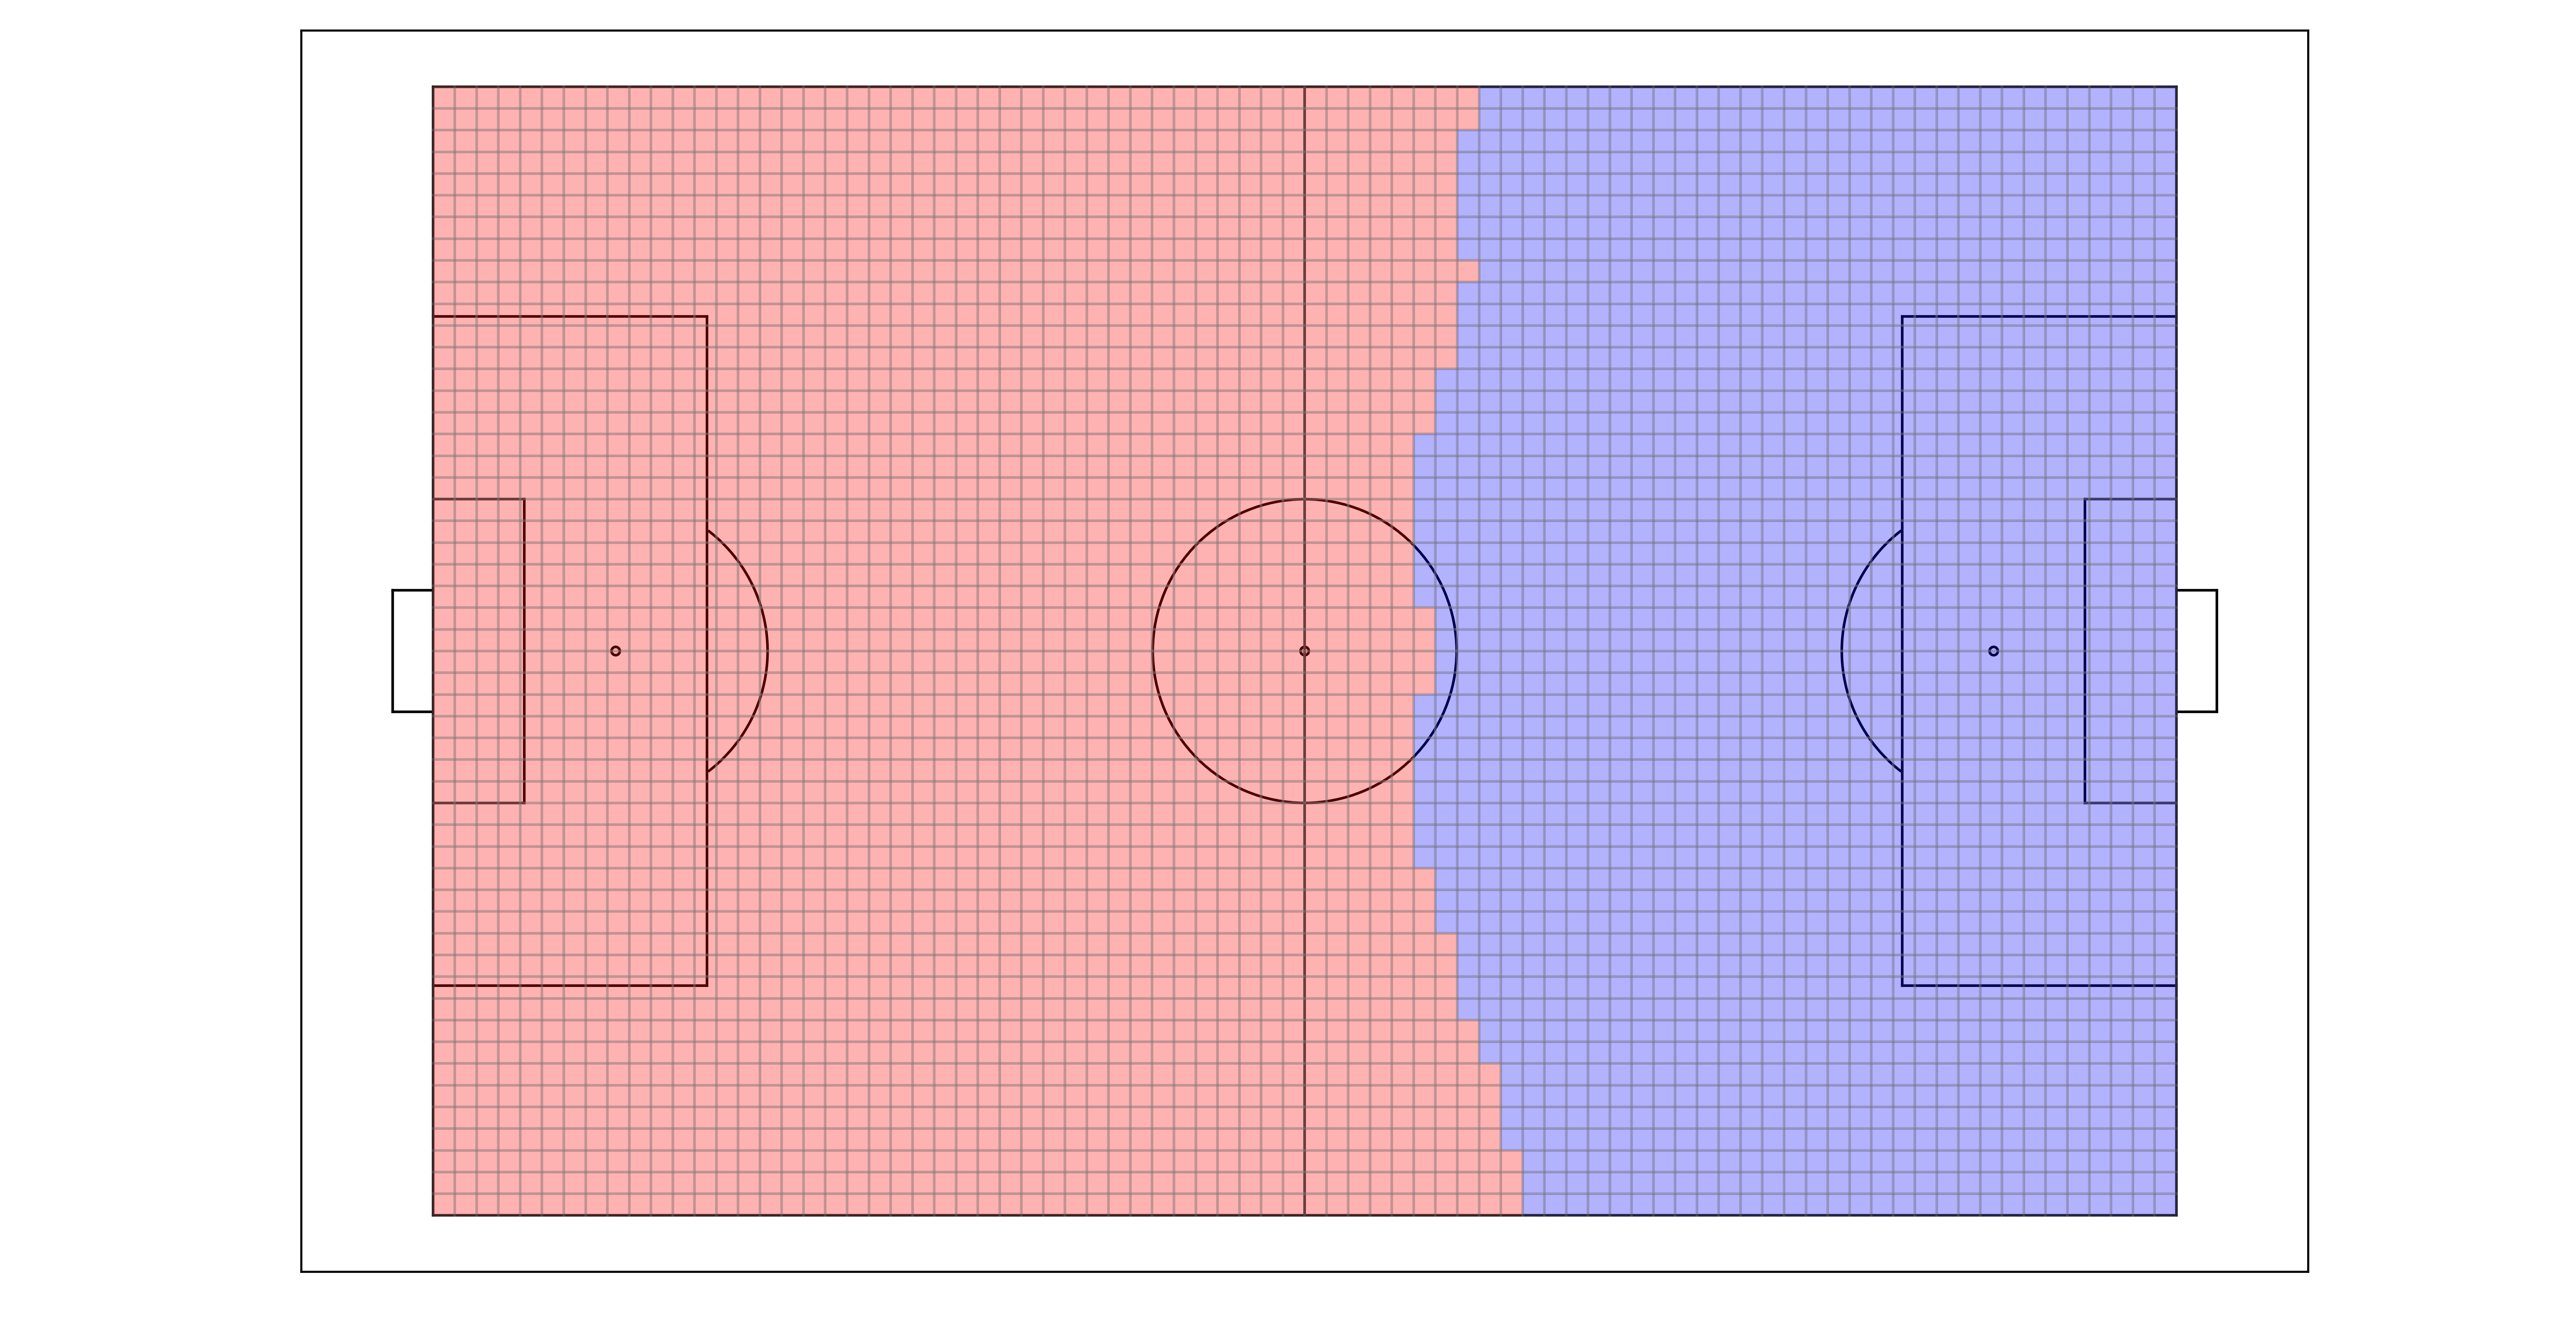
>>> # fitted_dvm_model has square mesh
>>> ax = pitch.plot(color_scheme="bw")
>>> fitted_dvm_model.plot(ax=ax)

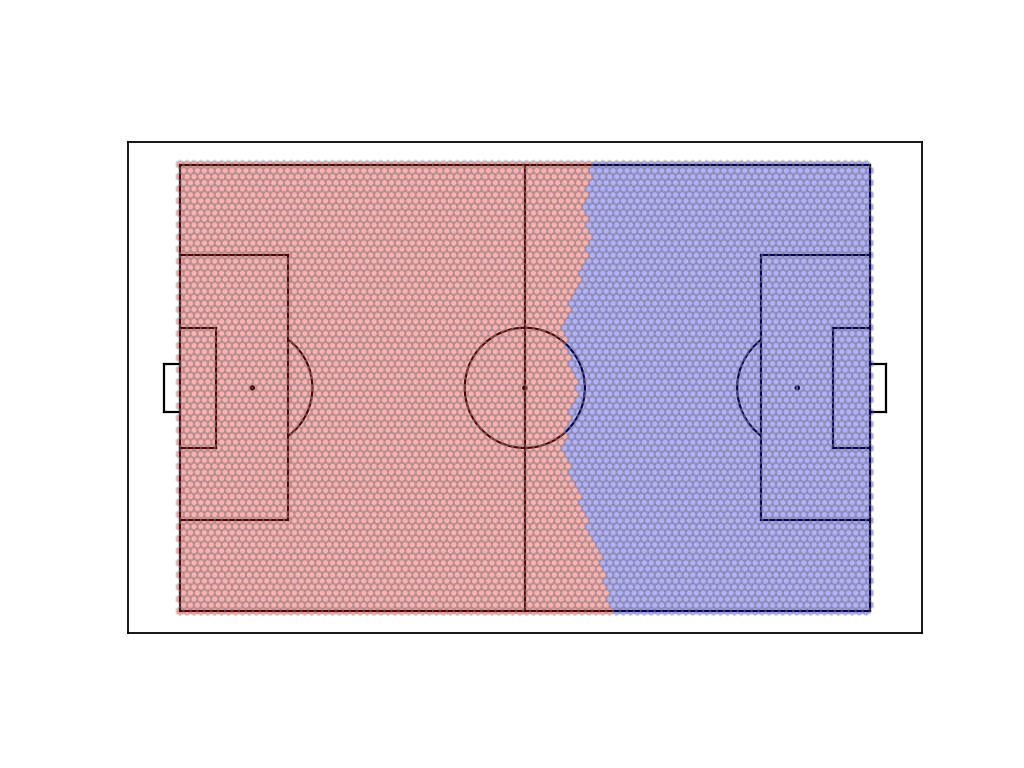
>>> # fitted_dvm_model has hexagonal mesh
>>> ax = pitch.plot(color_scheme="bw")
>>> fitted_dvm_model.plot(ax=ax)

- plot_mesh(ax=None)[source]
Plots the generated mesh on a matplotlib.axes.
- Parameters
ax (matplotlib.axes, optional) – Matplotlib axes on which the mesh points are plotted. If ax is None, a default-sized matplotlib.axes object is created.
- Returns
axes – Matplotlib axes on which the mesh points are plotted.
- Return type
matplotlib.axes
Examples
Given a DiscreteVoronoiModel that has already been fitted:
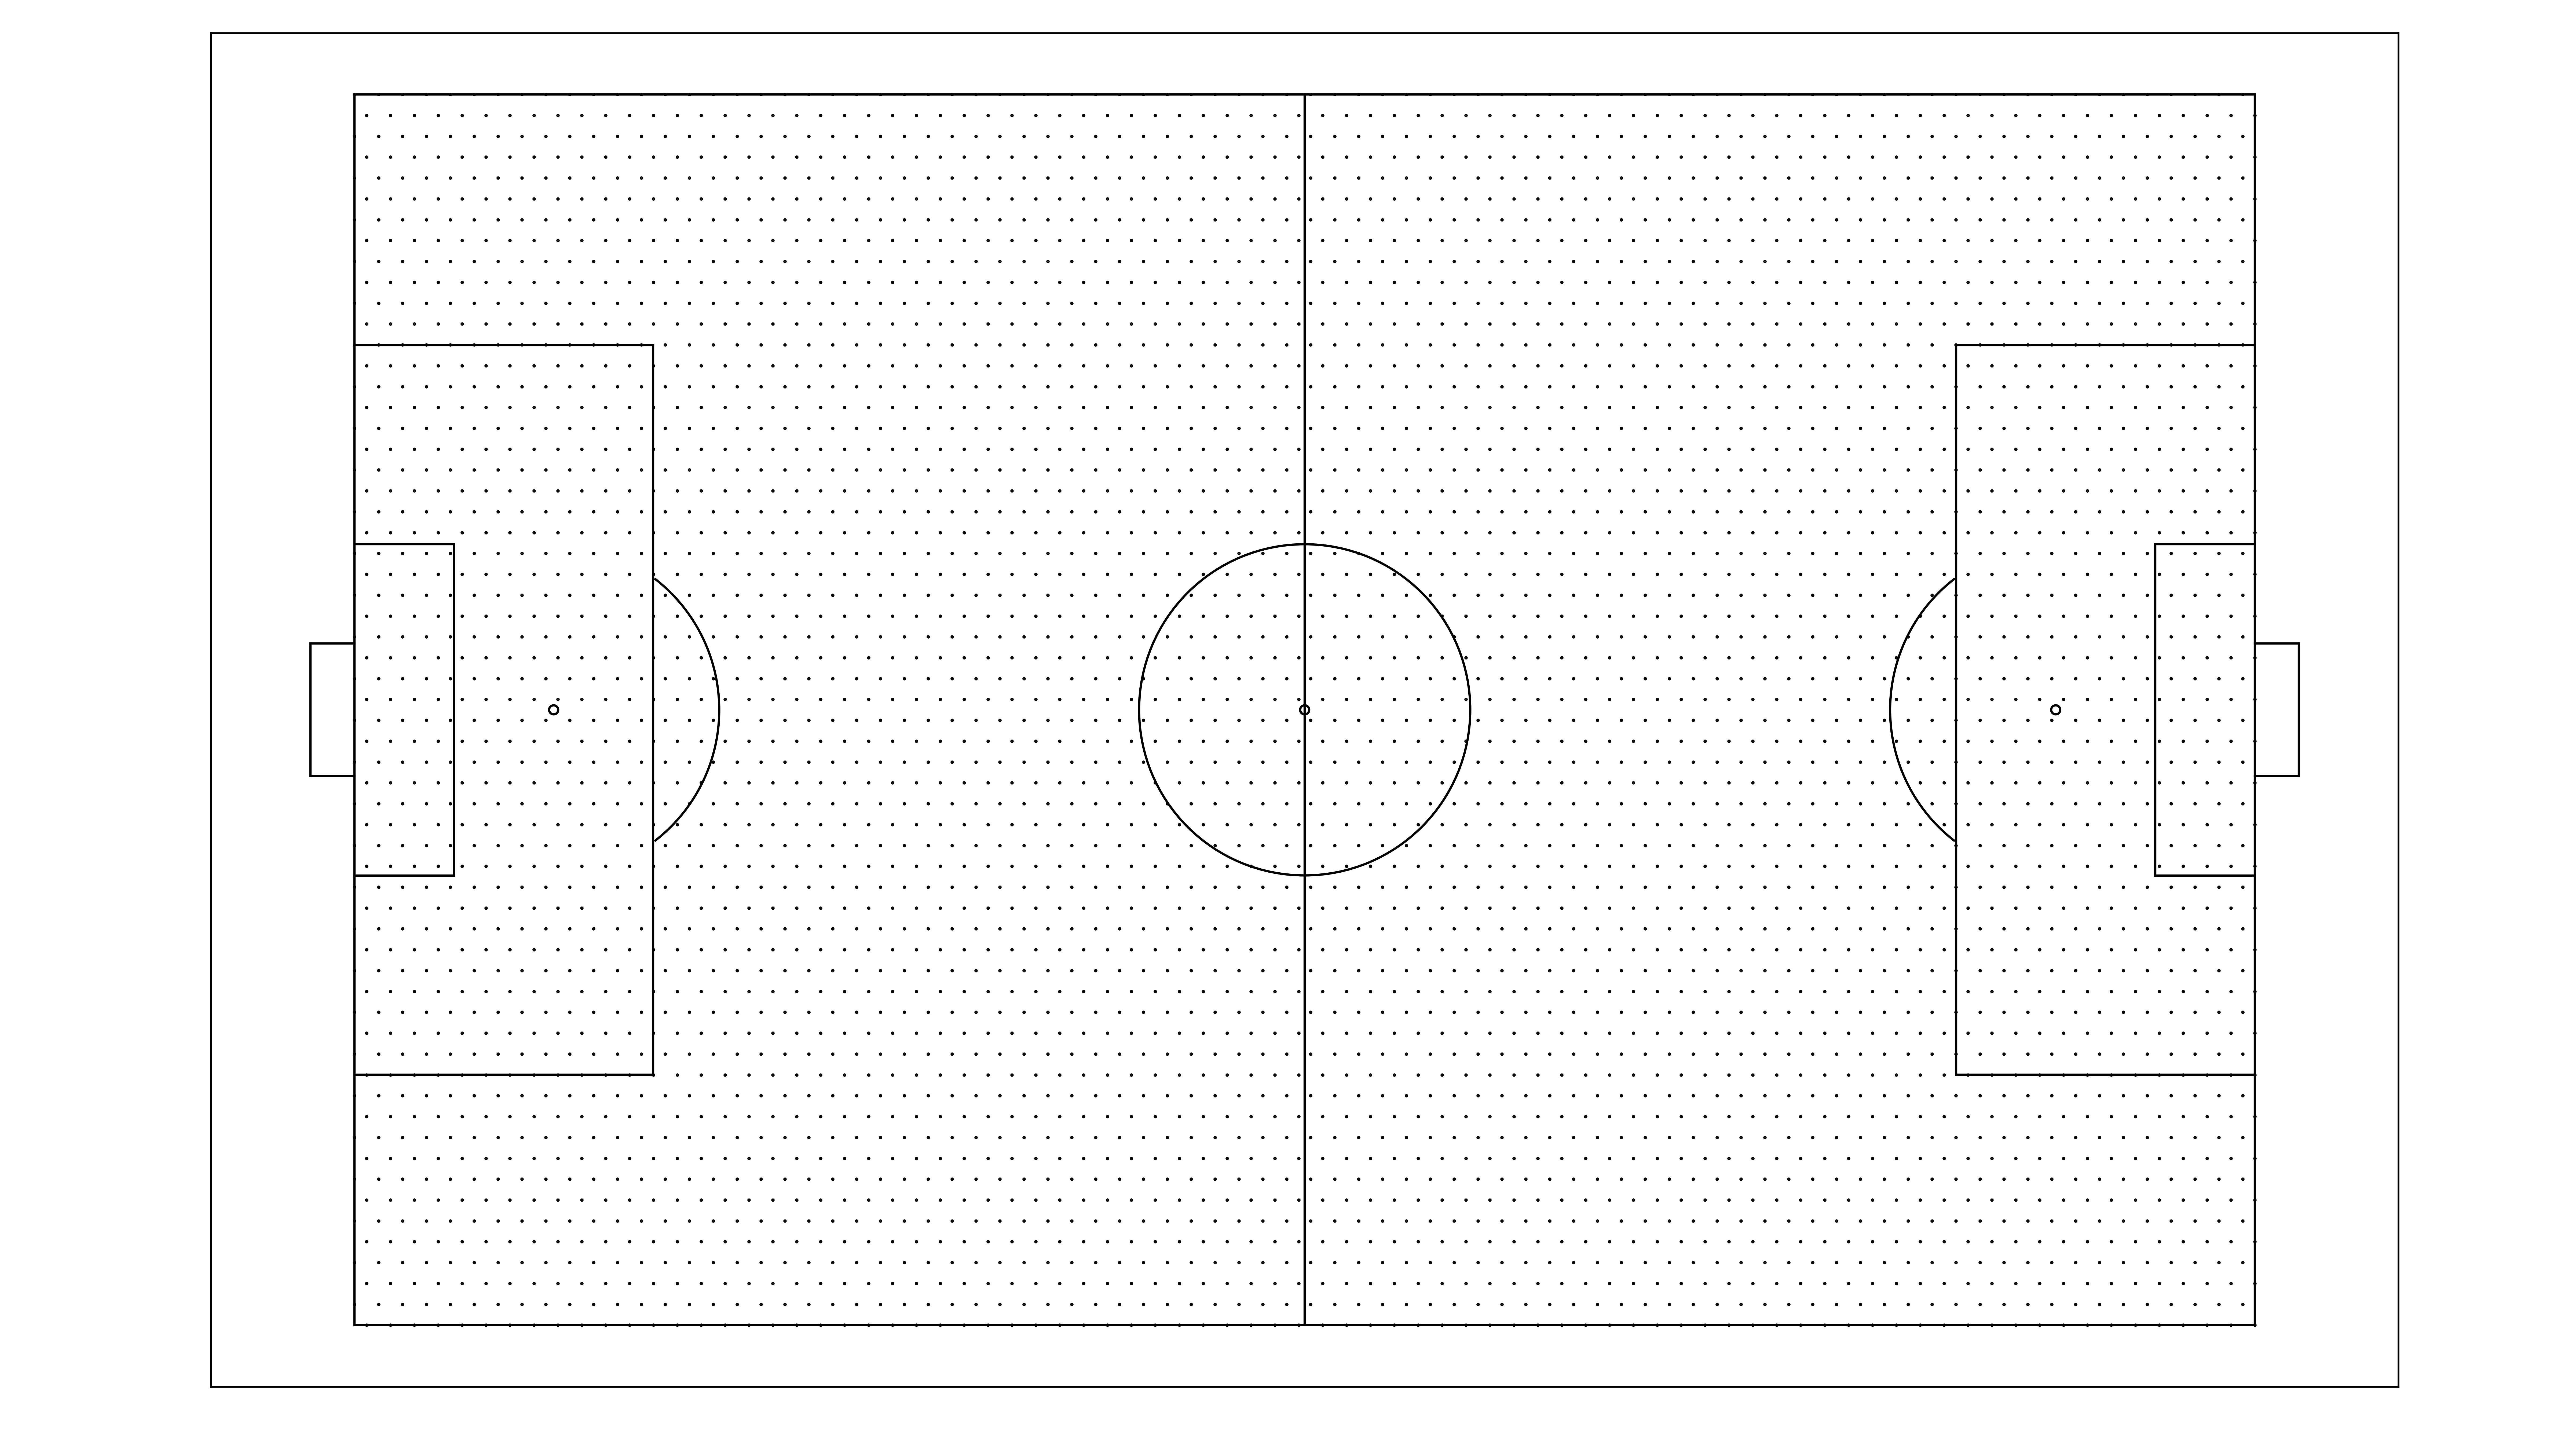
>>> ax = pitch.plot(color_scheme="bw")
>>> fitted_dvm_model.plot_mesh(ax=ax)

- team_controls()[source]
Returns the percentage of mesh points controlled by the first and second team.
- Returns
team_controls – One Property object for each team (corresponding to the fitted xy1 and xy2) of shape (n_frames x 1), respectively. Property objets contain the percentage of points controlled by each team on the pitch.
- Return type
Tuple[TeamProperty, TeamProperty]